November 29, 2023
Dear Investors and Friends,
In last month’s letter, Mike and I did a deep dive into what historical data says about the performance of US equities vs. developed country equities and the implication on RCM’s approach to equity asset allocation. In this month’s letter, we continue our discussion of equities by examining what historical data says about the performance of US equities vs. emerging market equities and the implication on RCM’s approach to equity asset allocation.
Review of Key Takeaways from October 2023 Letter
As mentioned above, our October 2023 letter covered equities looking at the outperformance of US equities over developed country equities given various time horizons since 1970. They key takeaways from that letter were:
- Over a horizon of 25 years, US equities outperform developed country equities 100.0% of the time,
- Over a horizon of 15 years, US equities outperform developed country equities 89.5% of the time, and
- Over the horizons evaluated, the annual average outperformance of US equities vs. developed country equities ranges from 3.9% to 5.0%.
The Historical Performance of US Equities vs. Emerging Market Equities
Of course, comparing US equities to developed markets only tells part of the story. What about emerging markets? According to a 2021 Morgan Stanley paper on emerging markets portfolio allocations, the average global investor holds somewhere between 6% to 8% of their portfolio in emerging markets. Is this too low, too high or just right?
We would like to make the case that, particularly for the US Investor, there is little evidence one should be invested in emerging markets at all. The chart below is a comparison of US equities, as represented by the S&P 500 (Bloomberg ticker: SPXT Index), to emerging market equities, as represented by the MSCI Emerging Markets Index (Bloomberg ticker: MXEF Index), since 1988. It shows two things
- The blue bars highlight the frequency with which US equities outperformed emerging market equities over various time horizons, and
- The grey markers / line indicate the average annual outperformance of US equities over emerging market equities over those time horizons.
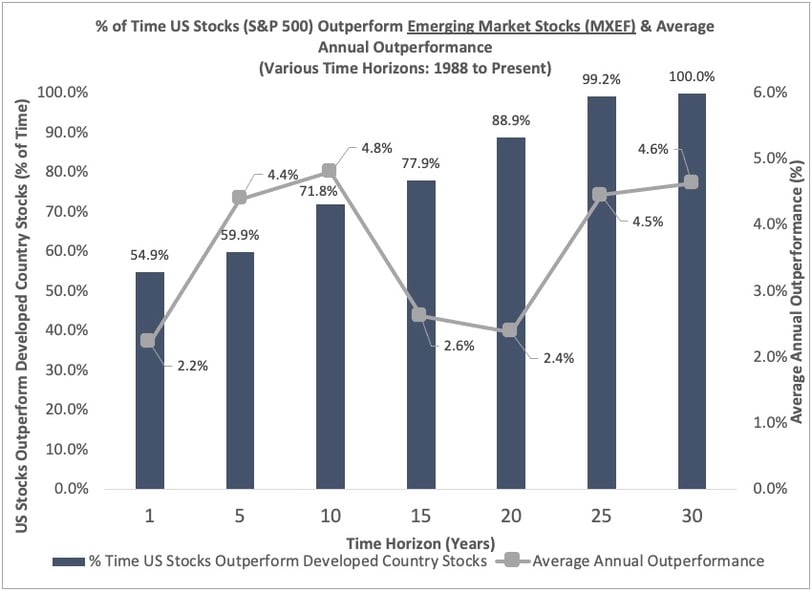
The chart is illuminating. To illustrate what it is saying, given a horizon of 30 years, SPXT outperformed MXEF 100% of the time with an average annual outperformance of 4.6%. Additionally, there is not a period evaluated where US equities did not meaningfully outperform.
An Explanation for the Outperformance and a View on its Continuance (Originally posted October 2023)
A detailed explanation for this outperformance is beyond the scope of this letter but we believe a few of the qualitative explanatory variables include the relative stability, transparency, predictability, rule of law, property rights, system of taxation, culture of entrepreneurship and innovation, size, financial strength, and access to capital of the United States vs. the other developed countries.
Will the outperformance continue? We certainly do not have a crystal ball and we, like many, are concerned about the decline in our country’s financial strength as represented by the increase in debt to GDP, as well as the internal division and strong polarization amongst the people of our country. Although, a decline in financial strength and an increase in divisiveness are currently plaguing much of the developed world, so while the US has declined, so have others.
We read many who say that America’s best days are over. We respectfully but fervently disagree. To quote Warren Buffett from his last annual letter, “America's dynamism has made a huge contribution to whatever success Berkshire has achieved -- a contribution Berkshire will always need. We count on the American Tailwind and, though it has been becalmed from time to time, its propelling force has always returned. I have been investing for 80 years -- more than one-third of our country's lifetime. Despite our citizens' penchant -- almost enthusiasm -- for self-criticism and self-doubt, I have yet to see a time when it made sense to make a long-term bet against America. And I doubt very much that any reader of this letter will have a different experience in the future.”
RCM Approach
As stated in earlier letters, at our firm we break down your capital into distinct "buckets" based on various constraints or objectives. Each bucket is thoughtfully allocated to asset classes that align with its unique goals. Long term capital is placed in equities, medium term capital is invested in bonds and short-term capital is allocated to short duration Treasuries.
Given the historical data above combined with our view that America ultimately rises to overcome its challenges, in our clients’ equity buckets we have a strong bias towards allocating capital to US domiciled equities.
Please reach out to us with questions and comments. Thank you for trusting RCM with your capital. It is a privilege for us to serve you.
David and Mike

Disclaimer
Roosevelt Capital Management LLC is a registered investment adviser. Information presented is for educational purposes only and does not intend to make an offer or solicitation for the sale or purchase of any specific securities, investments, or investment strategies. Investments involve risk and are not guaranteed. Be sure to first consult with a qualified financial adviser and/or tax professional before implementing any strategy discussed herein.
Past performance is not indicative of future performance. Principal value and investment return will fluctuate. No guarantees or assurances that the target returns will be achieved, or objectives will be met are implied. Future returns may differ significantly from past returns due to many different factors. Investments involve risk and the possibility of loss of principal.
While all the values used in this report were obtained from sources believed to be reliable, all calculations that underly numbers shown in this report believed to be accurate, and all assumptions made in this report believed to be reasonable, Roosevelt Capital Management LLC neither represents nor warrants the values, calculations or assumptions and encourages each prospective investor to conduct their own review of the audits, values, calculations and assumptions.