May 01, 2021
Stories about the rise of post-pandemic inflation are everywhere right now. As with so many things in the news these days, however, much of the information being conveyed is politically motivated, superficial, or just plain wrong. Of course, it is one thing to pontificate about where inflation is headed, but quite another to invest one’s precious capital based on those expectations.
Fortunately, the United States Treasury has provided investors with an unambiguous mechanism to establish the market’s expectations about future inflation. The purpose of this month’s newsletter is to provide an overview of how the market signals expected inflation.
Treasury Inflation-Protected Securities
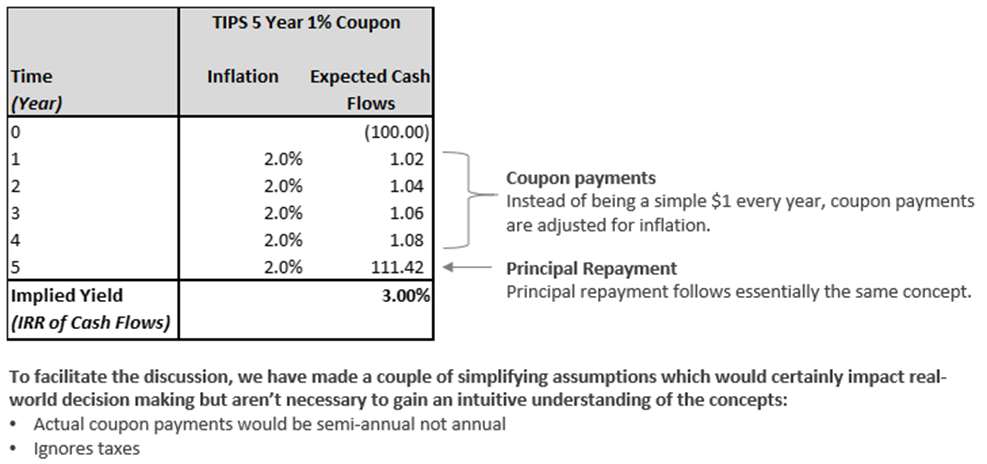
The United States government issues debt to fund its deficits. Since 1997, it has issued Treasury Inflation-Protected Securities, also known as “TIPS.” These securities are designed to protect investors against inflation by adjusting the amount of principal that the investor is owed based upon the Consumer Price Index[1], also known as the “CPI.” Additionally, the securities pay interest semi-annually based on the adjusted principal, so the interest payments are also protected from inflation. Most importantly, because investors’ money is at risk, they have a vested interest in estimating inflation accurately. Shown below is a simplified example of a hypothetical TIPS bond purchased for $100 assuming CPI increases roughly 2.0% per year over the life of the bond:
Comparing a TIPS to a “Normal” Treasury Bond
Returning to the bond above, assume the government is also issuing a non-inflation protected 5-year Treasury note with a 3.00% coupon. Once again, accept that we know with certainty that CPI is going to increase around 2.00% per year. Compare the two sets of cash flows:
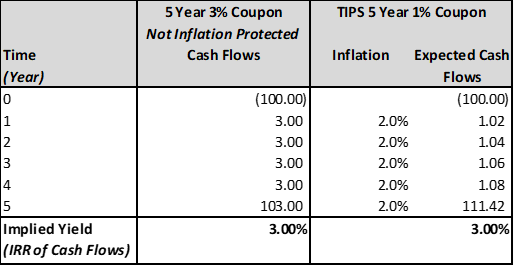
Notice that the cash flows of the non-inflation protected security and the inflation protected security result in the same after inflation yield. That leads us to the concept of breakeven rates.[1]
Defining Breakeven Rates
If the market is efficient, as assumed in the example above, an investor should be indifferent to the two bonds we have been discussing because the after-inflation return is the same for both. It follows, then, that the difference in the two bonds before inflation rate of return, 3% for the non-inflation protected security and 1% for the inflation protected security, reflects the market’s view of what inflation will be over the next 5 years, or 2%. This is known as the breakeven rate. Breakeven rates are a proxy for expected inflation and are the difference between the yield on a non-inflation protected Treasury bond and the corresponding inflation protected Treasury of the same maturity.
Today’s Breakeven Rates
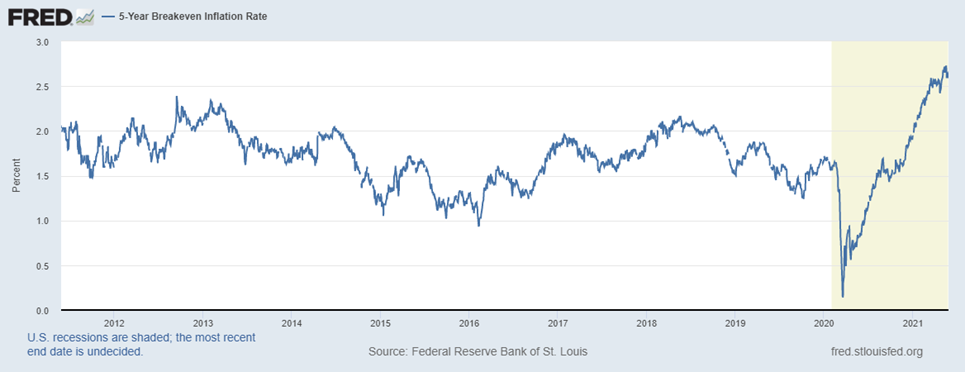
Now, let us return to the real world where the CPI values above are forecasts not known values. The 5-year breakeven rate today is 2.59%. That means that the market’s expectation is that inflation, as measured by the CPI, will average 2.59% per year over the next 5 years. The chart on the following page shows how this rate has changed over time. Notice the rapid increase in the breakeven from 0.16% on March 16, 2020, the height of pandemic uncertainty, to its 10-year high today.
How Good Have Breakeven Rates Been at Predicting Actual Inflation
Below is a chart showing actual 5-year annualized inflation as measured by the CPI less the 5-year breakeven rate through April 2016, after which we cannot make a comparison. A couple interesting statistics about the data: on average the difference between actual inflation and the 5-year breakeven is 0.05% and the median difference is -0.19%.
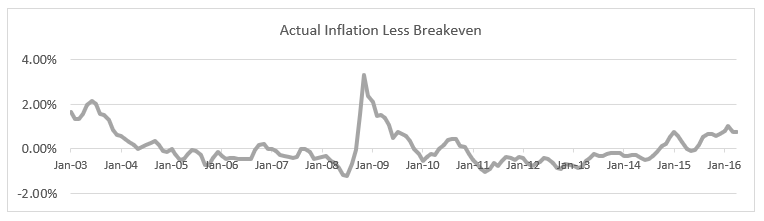
What observations can we make? First, given the median, most of the time the market overestimates what inflation will be (breakeven higher than actual). This makes sense given that TIPS are effectively insurance against runaway inflation. Second, the average is skewed for periods where breakevens significantly underprice future inflation. These tend to be during periods of great economic and market stress like the Great Recession of 2008 where investors predict prolonged periods of no to low growth. Third, despite the volatility in the difference, 86% of the time the actual inflation is within 1% of the breakeven expectation – not too bad given that what people expect and what actually happens are two different things.
Your RCM Portfolio and Inflation
We continue to field questions from investors regarding how their portfolios will do if we have prolonged high inflation. We expect your RCM portfolio will fare well in any environment but do better in an inflationary one. The key reason is the short duration nature of the securities you own combined with the higher yields that accompany inflation. Compared to a medium or longer duration portfolio, your portfolio is frequently throwing off principal. Inflation would allow us to reinvest your principal at higher yields resulting in higher returns on your capital.
Please reach out to us with questions and comments. Thank you for trusting RCM with your capital. It is a privilege for us to serve you.
David and Mike
[1] The Consumer Price Index is produced by the Bureau of Labor Statistics. We acknowledge that the CPI is a far from perfect measure of inflation and recognize the ongoing debates about whether it overstates or understates reality. We will delve into this controversy in a future letter.
[2] It should be noted that, in the real world, expectations about inflation would likely not align so perfectly as in our example above. The math is a bit more complex because one must begin incorporating other variables when valuing real bonds, but the concept remains the same. The breakeven rate is simply the difference between the yield on the non-TIPS bond and the before inflation yield on the TIPS bond.
Disclaimer
Roosevelt Capital Management LLC is a registered investment adviser. Information presented is for educational purposes only and does not intend to make an offer or solicitation for the sale or purchase of any specific securities, investments, or investment strategies. Investments involve risk and are not guaranteed. Be sure to first consult with a qualified financial adviser and/or tax professional before implementing any strategy discussed herein.
Past performance is not indicative of future performance. Principal value and investment return will fluctuate. No guarantees or assurances that the target returns will be achieved, or objectives will be met are implied. Future returns may differ significantly from past returns due to many different factors. Investments involve risk and the possibility of loss of principal.
The performance and characteristics information contained herein is for accounts solely managed by David Roosevelt, Managing Member of Roosevelt Capital Management LLC. Investment performance and characteristics through September 2019 are for Roosevelt Investments accounts managed by David Roosevelt. Investment performance and characteristics for October 2019 and thereafter are for Roosevelt Capital Management accounts managed by David Roosevelt. The performance information has been certified by ACA Compliance through December 31, 2018 and is available upon request. The values and performance information contained herein do not reflect management fees. While all the values used in this report were obtained from sources believed to be reliable, all calculations that underly numbers shown in this report believed to be accurate, and all assumptions made in this report believed to be reasonable, Roosevelt Capital Management LLC neither represents nor warrants the reports, values, calculations or assumptions and encourages each prospective investor to conduct their own review of the reports, values, calculations and assumptions.