March 01, 2021
If you spend any time in the fixed income world, you are likely to come across a bond statistic called “modified duration”. If the term is new to you, the definitions online or in articles are often confusing because the actual calculation is somewhat complex and typically assumes some knowledge of the more arcane corners of bond math. Fortunately, modified duration is one of those ideas that can be understood conceptually even without an understanding of precisely how the calculation is done. This is good because a basic understanding of modified duration provides valuable perspective on the potential risks and opportunities inherent in your fixed income portfolio all in a single number.
The purpose of this month’s newsletter is to try to provide a conceptual introduction to modified duration and to explain why RCM chooses to remain in “short duration bonds”.
Modified Duration: A Visual Example
Consider a bond with a 10-year maturity and a coupon of 4% paid semi-annually. Once one knows these three facts about the bond, the relationship between price and yield-to-maturity can be plotted. Modified duration is nothing more than an estimate of how much the price will change given a known change in the yield. A key word here is “estimate” because, as the graph below shows, the relationship is a curve, not a straight line.[1]

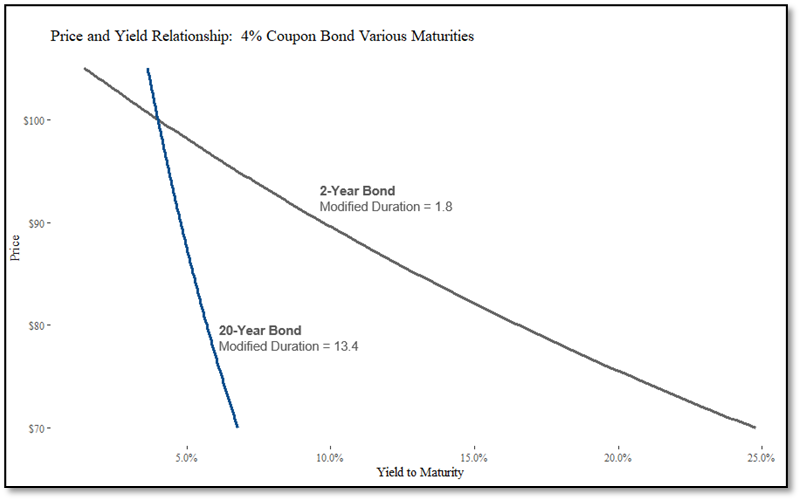
The Impact of Time on Modified Duration
While there are several variables that go into determining a bond’s modified duration, the most significant variable by far is time to maturity. Compare these two otherwise identical bonds. The 20-year bond is much more sensitive to even a small change in the yield than the 2-year bond. The 20-year line is simply “steeper”, and the slope between any two points on the curve is what modified duration is capturing.
Modified Duration and Interest Rates
The real magic of modified duration becomes apparent when we look at changes in interest rates (i.e., the conventional and somewhat confusing term for yield to maturity on government bonds). In the fixed income world, corporate bond yields respond to changes in government yields with remarkable consistency over time (see chart below). Since, government rates tend to move prior to changes in corporate debt yields, practitioners need a mechanism to quickly incorporate the impact of changes in government rates to their own corporate fixed income portfolios. Modified duration provides this mechanism. If I know that the yield on 10-year US Treasuries just increased by 25 basis points, I can extrapolate that the yield on my 10-year corporate bonds will likely increase by at least that amount, and I can use modified duration to estimate the impact on its price. Note that the difference between the yield on a corporate bond and the Treasury with the same corresponding maturity is known as the "spread". In the chart below the spread is the distance between the two lines at any given time. The spread can also fluctuate, and we will make this the topic of a future letter.

Impact for RCM Clients
In our newsletters and client conversations, we nearly always talk about the two primary risks of fixed income investing – default risk and interest rate risk. At RCM, we spend almost all our time and energy managing default risk and very little time managing interest rate risk. When we make that latter point about interest rate risk, what we mean, more precisely, is that we are able to largely ignore interest rate risk because short duration bonds, bonds with a small modified duration number, have limited interest rate risk.
This is an extremely important point and one that is often overlooked even by investment professionals investing in fixed income products for their clients. For example, if interest rates rise quickly as they did a few weeks ago, two otherwise identical bond portfolios can have dramatically different responses. The short duration portfolio might only have a mark-to-market decline of 0.30% to 0.40% while the long duration portfolio might be down 7.0% to 8.0%, a dramatic difference.
Conclusion
All other things being equal, in today’s market environment where interest rates are extremely low by historical standards and increases in interest rates and inflation are both potential clouds on the horizon, it is our belief that short duration high yield corporate bond portfolios provide our clients with the right mix of return potential and ability to react to changes in the market. If interest rates were to rise dramatically, like they did in the late ‘70s and early ‘80s, we will likely alter our thinking and recommend taking more interest rate risk. Until we are appropriately compensated for taking interest rate risk, being “short duration” will remain a foundational principal in RCM’s high yield corporate bond strategy.
Please reach out to us with questions and comments. Thank you for trusting RCM with your capital. It is a privilege for us to serve you.
David and Mike
[1] Note: Determining the exact change in price for any two known points on the line requires a more advanced calculation called “modified duration with convexity”. This concept is beyond the scope of this brief newsletter, but I mention it here for anyone more mathematically inclined looking at the curved line above and thinking to themselves that a single number cannot truly represent a change anywhere on the line.
Disclaimer
Roosevelt Capital Management LLC is a registered investment adviser. Information presented is for educational purposes only and does not intend to make an offer or solicitation for the sale or purchase of any specific securities, investments, or investment strategies. Investments involve risk and are not guaranteed. Be sure to first consult with a qualified financial adviser and/or tax professional before implementing any strategy discussed herein.
Past performance is not indicative of future performance. Principal value and investment return will fluctuate. No guarantees or assurances that the target returns will be achieved, or objectives will be met are implied. Future returns may differ significantly from past returns due to many different factors. Investments involve risk and the possibility of loss of principal.
The performance and characteristics information contained herein is for accounts solely managed by David Roosevelt, Managing Member of Roosevelt Capital Management LLC. Investment performance and characteristics through September 2019 are for Roosevelt Investments accounts managed by David Roosevelt. Investment performance and characteristics for October 2019 and thereafter are for Roosevelt Capital Management accounts managed by David Roosevelt. The performance information has been certified by ACA Compliance through December 31, 2018 and is available upon request. The values and performance information contained herein do not reflect management fees. While all the values used in this report were obtained from sources believed to be reliable, all calculations that underly numbers shown in this report believed to be accurate, and all assumptions made in this report believed to be reasonable, Roosevelt Capital Management LLC neither represents nor warrants the reports, values, calculations or assumptions and encourages each prospective investor to conduct their own review of the reports, values, calculations and assumptions.